Magnesium for PRAL Alkalinity
Magnesium is the second alkaline component of the PRAL calculation for pH Balance Diet Score. That PRAL calculation has links to top food lists for other nutrients.
We need magnesium for over 300 processes in our body. These cover many vital functions, including nerves, muscles, immune system, bones, and heart.
Magnesium is found in many foods, including:
- Spinach, bananas, dried apricots, avocados, and many other vegetables and fruits
- Almonds, cashews, and other nuts
- Peas, beans, and other legumes and seeds
- Tofu, soy flour, and other soy products
- Brown rice, millet, and other whole grains
Excess magnesium is rare, as our kidneys remove any we do not use. Despite this, the Department of Health magnesium fact sheet for health professionals reports:
Dietary surveys of people in the United States consistently show that intakes of magnesium are lower than recommended amounts.
Magnesium Deficiency and Inadequacy
As intake is generally lower than required, many people are classed as having magnesium inadequacy. This is not immediately severe, but as magnesium is required by so many processes, the effects can be widespread.
Early signs of magnesium deficiency include loss of appetite, nausea, vomiting, fatigue, and weakness. As magnesium deficiency worsens, numbness, tingling, muscle contractions and cramps, seizures, personality changes, abnormal heart rhythms, and coronary spasms can occur. Severe magnesium deficiency can result in hypocalcemia or hypokalemia (low serum calcium or potassium levels, respectively) because mineral homeostasis is disrupted.
Heavy drinking, amongst other things, can move inadequacy to deficiency. However, one factor that we can do little to change is the aging process. As we get older, we need more magnesium, but studies indicate we eat less.
Normal Magnesium Intake for pH Balance
Requirements vary with age and gender. The Daily Value used in food labeling is 400 milligrams per day.
This is easy to achieve using a few of the top selections from my list of foods high in magnesium.
High Magnesium Foods List
My high potassium foods list shows all components of the PRAL calculation, with data initially presented in potassium content order. You can click on headings (the nutrient name) for different sequences, and repeat clicking reverses the sort order.
I list foods in serving sizes that provide 100 calories of energy. For pH balance, about 80% of what you eat should be alkaline. Alkaline-forming foods show as negative PRAL scores. You can click links in the table headings for more information.
|
. |
PRAL Nutrients Explanation | Cals Help | PRAL Help | Pro tein Help |
Phos phorus Help |
Potas sium Help |
Mag nesium Help |
Cal cium Help |
|
. |
Long Description | 100 Kcal Serve (g) | PRAL Score | Pro tein (g) |
Phos phorus (mg) |
Potas sium (mg) |
Mag nesium (mg) |
Cal cium (mg) |
|
. |
Spinach, cooked, boiled, drained, without salt | 435 | -45 | 12.9 | 243 | 2,026 | 378 | 591 |
|
. |
Spinach, raw | 435 | -51 | 12.4 | 213 | 2,426 | 343 | 430 |
|
. |
Spinach, canned, regular pack, drained solids | 435 | -34 | 12.2 | 191 | 1,504 | 330 | 552 |
|
. |
Spinach, frozen, chopped or leaf, cooked, boiled, drained, without salt | 294 | -20 | 11.8 | 147 | 888 | 241 | 450 |
|
. |
Cocoa, dry powder, unsweetened, processed with alkali | 45 | -14 | 8.2 | 331 | 1,140 | 216 | 50 |
|
. |
Soy sauce made from soy and wheat (shoyu) | 189 | -3 | 15.4 | 313 | 821 | 140 | 62 |
|
. |
Parsley, raw | 278 | -31 | 8.3 | 161 | 1,539 | 139 | 383 |
|
. |
Chicory greens, raw | 435 | -36 | 7.4 | 204 | 1,826 | 130 | 435 |
|
. |
Squash, summer, all varieties, cooked, boiled, drained, without salt | 500 | -16 | 4.6 | 195 | 960 | 120 | 135 |
|
. |
Turnip greens, cooked, boiled, drained, without salt | 500 | -25 | 5.7 | 145 | 1,015 | 110 | 685 |
|
. |
Cucumber, peeled, raw | 833 | -19 | 4.9 | 175 | 1,133 | 100 | 117 |
|
. |
Coffee, instant, regular, powder | 28 | -19 | 3.5 | 86 | 1,001 | 93 | 40 |
|
. |
Endive, raw | 588 | -35 | 7.4 | 165 | 1,847 | 88 | 306 |
|
. |
Lettuce, green leaf, raw | 667 | -21 | 9.1 | 193 | 1,293 | 87 | 240 |
|
. |
Lettuce, cos or romaine, raw | 588 | -25 | 7.2 | 176 | 1,453 | 82 | 194 |
|
. |
Coffee, brewed, espresso, restaurant-prepared * | 100 | -4 | 0.1 | 7 | 115 | 80 | 2 |
|
. |
Mustard, prepared, yellow | 149 | 2 | 6.5 | 158 | 206 | 73 | 87 |
|
. |
Broccoli, frozen, spears, cooked, boiled, drained, without salt | 357 | -5 | 11.1 | 196 | 643 | 71 | 182 |
|
. |
Cereals ready-to-eat, bran flakes, single brand | 31 | 2 | 3.2 | 164 | 172 | 69 | 17 |
|
. |
Celery, raw | 625 | -31 | 4.3 | 150 | 1,625 | 69 | 250 |
|
. |
Formulated bar, POWER BAR, chocolate | 28 | 2 | 3.9 | 169 | 100 | 68 | 139 |
|
. |
Beans, snap, green, frozen, cooked, boiled, drained without salt | 357 | -9 | 5.3 | 104 | 568 | 68 | 150 |
|
. |
Tomato products, canned, sauce | 417 | -25 | 5.5 | 108 | 1,379 | 67 | 54 |
|
. |
Baking chocolate, unsweetened, squares | 20 | -1 | 2.6 | 80 | 166 | 65 | 20 |
|
. |
Cabbage, cooked, boiled, drained, without salt | 435 | -14 | 5.5 | 143 | 852 | 65 | 209 |
|
. |
Tomato juice, canned, with salt added | 588 | -25 | 4.5 | 106 | 1,347 | 65 | 59 |
|
. |
Tomatoes, red, ripe, canned, packed in tomato juice | 588 | -21 | 4.6 | 112 | 1,106 | 65 | 182 |
|
. |
Kale, cooked, boiled, drained, without salt | 357 | -15 | 6.8 | 100 | 814 | 64 | 257 |
|
. |
Asparagus, cooked, boiled, drained | 455 | -10 | 10.9 | 245 | 1,018 | 64 | 105 |
|
. |
Collards, cooked, boiled, drained, without salt | 303 | -7 | 8.2 | 97 | 355 | 64 | 427 |
|
. |
Onions, spring or scallions (includes tops and bulb), raw | 313 | -16 | 5.7 | 116 | 863 | 63 | 225 |
|
. |
Broccoli, raw | 294 | -12 | 8.3 | 194 | 929 | 62 | 138 |
|
. |
Tomatoes, red, ripe, raw, year round average | 556 | -23 | 4.9 | 133 | 1,317 | 61 | 56 |
|
. |
Broccoli, cooked, boiled, drained, without salt | 286 | -10 | 6.8 | 191 | 837 | 60 | 114 |
|
. |
Pickles, cucumber, dill or kosher dill | 833 | -16 | 5.0 | 100 | 767 | 58 | 350 |
|
. |
Vegetable juice cocktail, canned | 526 | -17 | 4.9 | 100 | 974 | 58 | 74 |
|
. |
Seeds, sunflower seed kernels, dried | 17 | 2 | 3.6 | 113 | 110 | 56 | 13 |
|
. |
Soup, stock, beef, home-prepared | 769 | -16 | 15.2 | 238 | 1,423 | 54 | 62 |
|
. |
Spices, chili powder | 35 | -11 | 4.8 | 106 | 691 | 53 | 117 |
|
. |
Beans, snap, green, canned, regular pack, drained solids | 400 | -7 | 5.0 | 84 | 424 | 52 | 152 |
|
. |
Sauce, salsa, ready-to-serve | 345 | -16 | 5.3 | 117 | 983 | 52 | 103 |
|
. |
Beans, snap, green, cooked, boiled, drained, without salt | 286 | -6 | 5.4 | 83 | 417 | 51 | 126 |
|
. |
Tomato products, canned, paste, without salt added | 122 | -22 | 5.3 | 101 | 1,237 | 51 | 44 |
|
. |
Tomato products, canned, paste, with salt added | 122 | -22 | 5.3 | 101 | 1,237 | 51 | 44 |
|
. |
Beans, pinto, mature seeds, raw | 29 | -3 | 6.2 | 118 | 401 | 51 | 33 |
|
. |
Beans, black, mature seeds, raw | 29 | -4 | 6.3 | 103 | 435 | 50 | 36 |
|
. |
Tomatoes, red, ripe, cooked | 556 | -19 | 5.3 | 156 | 1,211 | 50 | 61 |
|
. |
Lettuce, iceberg (includes crisphead types), raw | 714 | -16 | 6.4 | 143 | 1,007 | 50 | 129 |
|
. |
Peppers, sweet, green, raw | 500 | -15 | 4.3 | 100 | 875 | 50 | 50 |
|
. |
Mustard greens, cooked, boiled, drained, without salt | 385 | -9 | 9.8 | 162 | 623 | 50 | 454 |
|
. |
Cereals ready-to-eat, POST Raisin Bran Cereal | 31 | 1 | 2.4 | 119 | 168 | 49 | 16 |
|
. |
Cabbage, raw | 400 | -11 | 5.1 | 104 | 680 | 48 | 160 |
|
. |
Nuts, cashew nuts, oil roasted, with salt added | 17 | 1 | 2.9 | 91 | 109 | 47 | 7 |
|
. |
Nuts, almonds, dry roasted, without salt added | 17 | 0 | 3.5 | 79 | 119 | 47 | 45 |
|
. |
Nuts, almonds, dry roasted, with salt added | 17 | 0 | 3.5 | 79 | 119 | 47 | 45 |
|
. |
Nuts, almonds | 17 | 0 | 3.7 | 83 | 127 | 47 | 46 |
|
. |
Broccoli, frozen, chopped, cooked, boiled, drained, without salt | 357 | -1 | 11.1 | 175 | 507 | 46 | 118 |
|
. |
Peas, green, cooked, boiled, drained, without salt | 119 | 0 | 6.4 | 139 | 323 | 46 | 32 |
|
. |
Tomatoes, red, ripe, canned, stewed | 385 | -15 | 3.5 | 77 | 796 | 46 | 131 |
|
. |
Nuts, almonds, blanched | 17 | 1 | 3.6 | 82 | 112 | 45 | 40 |
|
. |
Beans, white, mature seeds, cooked, boiled, without salt | 72 | -4 | 7.0 | 81 | 404 | 45 | 65 |
|
. |
Cereals ready-to-eat, QUAKER, QUAKER Oat Bran Cereal | 27 | 2 | 3.3 | 139 | 118 | 45 | 51 |
|
. |
Crustaceans, crab, blue, cooked, moist heat | 120 | 12 | 21.5 | 282 | 312 | 43 | 110 |
|
. |
Mushrooms, white, cooked, boiled, drained, without salt | 357 | -13 | 7.8 | 311 | 1,271 | 43 | 21 |
|
. |
Brussels sprouts, frozen, cooked, boiled, drained, without salt | 238 | -7 | 8.7 | 133 | 690 | 43 | 62 |
|
. |
Cereals ready-to-eat, KELLOGG, KELLOGG’S ALL-BRAN COMPLETE Wheat Flakes | 31 | 3 | 3.1 | 158 | 158 | 42 | 16 |
|
. |
Refried beans, canned, traditional style (includes USDA commodity) | 110 | -2 | 5.9 | 122 | 369 | 42 | 36 |
|
. |
Strawberries, raw | 313 | -8 | 2.1 | 75 | 478 | 41 | 50 |
|
. |
Wheat flour, whole-grain | 29 | 2 | 3.9 | 105 | 107 | 40 | 10 |
|
. |
Tea, instant, unsweetened, lemon-flavored, powder | 29 | -20 | 2.1 | 31 | 1,001 | 40 | 8 |
|
. |
Cereals ready-to-eat, POST, GRAPE-NUTS Cereal | 28 | 2 | 3.1 | 97 | 114 | 39 | 12 |
|
. |
Cereals ready-to-eat, KELLOGG, KELLOGG’S RAISIN BRAN | 32 | 0 | 2.5 | 111 | 190 | 39 | 14 |
|
. |
Rice, brown, long-grain, cooked | 90 | 2 | 2.3 | 75 | 39 | 39 | 9 |
|
. |
Nuts, mixed nuts, dry roasted, with peanuts, with salt added | 17 | 1 | 2.9 | 73 | 117 | 38 | 12 |
|
. |
Nuts, mixed nuts, with peanuts, oil roasted, with salt added | 16 | 1 | 3.3 | 75 | 104 | 38 | 19 |
|
. |
Snacks, popcorn, air-popped | 26 | 2 | 3.3 | 93 | 85 | 37 | 2 |
|
. |
Beans, kidney, red, mature seeds, canned | 123 | 0 | 6.4 | 131 | 321 | 37 | 36 |
|
. |
Sauce, pasta, spaghetti/marinara, ready-to-serve | 204 | -11 | 2.9 | 69 | 651 | 37 | 55 |
|
. |
Octopus, common, cooked, moist heat | 61 | 5 | 18.2 | 170 | 384 | 37 | 65 |
|
. |
Cereals, oats, regular and quick and instant, not fortified, dry | 26 | 3 | 3.5 | 108 | 96 | 36 | 14 |
|
. |
Beans, baked, canned, with pork and tomato sauce | 106 | -1 | 5.5 | 123 | 314 | 36 | 60 |
|
. |
Cereals ready-to-eat, granola, homemade | 20 | 1 | 3.0 | 93 | 110 | 36 | 16 |
|
. |
Snacks, popcorn, microwave, low fat | 24 | 2 | 3.0 | 62 | 57 | 36 | 3 |
|
. |
Lentils, raw | 29 | 2 | 7.5 | 131 | 278 | 36 | 16 |
|
. |
Beans, kidney, red, mature seeds, cooked, boiled, without salt | 79 | 0 | 6.8 | 112 | 317 | 35 | 22 |
|
. |
Cereals, oats, instant, fortified, plain, dry | 28 | 2 | 3.3 | 117 | 101 | 35 | 97 |
|
. |
Melons, cantaloupe, raw | 294 | -15 | 2.5 | 44 | 785 | 35 | 26 |
|
. |
Mollusks, oyster, eastern, wild, raw | 196 | 4 | 11.2 | 190 | 306 | 35 | 116 |
|
. |
Squash, winter, all varieties, cooked, baked, without salt | 270 | -12 | 2.4 | 51 | 651 | 35 | 59 |
|
. |
Carrot juice, canned | 250 | -12 | 2.4 | 105 | 730 | 35 | 60 |
|
. |
Beans, pinto, mature seeds, cooked, boiled, without salt | 70 | -1 | 6.3 | 103 | 305 | 35 | 32 |
|
. |
Soymilk, original and vanilla, with added calcium, vitamins A and D | 233 | -4 | 6.0 | 100 | 284 | 35 | 286 |
|
. |
Corn, sweet, yellow, frozen, kernels cut off cob, boiled, drained, without salt | 123 | -2 | 3.1 | 98 | 288 | 35 | 4 |
|
. |
Cereals ready-to-eat, GENERAL MILLS, CHEERIOS | 26 | 0 | 3.2 | 127 | 170 | 34 | 106 |
|
. |
Vegetables, mixed, frozen, cooked, boiled, drained, without salt | 154 | -2 | 4.4 | 78 | 260 | 34 | 38 |
|
. |
Watermelon, raw | 333 | -7 | 2.0 | 37 | 373 | 33 | 23 |
|
. |
Tortillas, ready-to-bake or -fry, corn | 46 | 3 | 2.6 | 144 | 85 | 33 | 37 |
|
. |
Crustaceans, shrimp, mixed species, canned | 100 | 13 | 20.4 | 195 | 80 | 33 | 145 |
|
. |
Peanut butter, smooth, reduced fat | 19 | 1 | 5.0 | 71 | 129 | 33 | 7 |
|
. |
Milk, nonfat, fluid, with added vitamin A and vitamin D (fat free or skim) | 294 | 1 | 9.9 | 297 | 459 | 32 | 359 |
|
. |
Milk, nonfat, fluid, without added vitamin A and vitamin D (fat free or skim) | 294 | 1 | 9.9 | 297 | 459 | 32 | 359 |
|
. |
Bread, whole-wheat, commercially prepared, toasted | 33 | 3 | 5.3 | 99 | 107 | 32 | 42 |
|
. |
Lentils, mature seeds, cooked, boiled, without salt | 86 | 2 | 7.8 | 155 | 318 | 31 | 16 |
|
. |
Crustaceans, shrimp, mixed species, raw | 141 | 17 | 19.2 | 344 | 159 | 31 | 76 |
|
. |
Cereals ready-to-eat, QUAKER, QUAKER OATMEAL SQUARES | 26 | 2 | 3.0 | 98 | 96 | 31 | 54 |
|
. |
Milk, dry, nonfat, regular, without added vitamin A and vitamin D | 28 | -1 | 10.0 | 267 | 496 | 30 | 347 |
|
. |
Bananas, raw | 112 | -8 | 1.2 | 25 | 402 | 30 | 6 |
|
. |
Potato, baked, flesh and skin, without salt | 108 | -9 | 2.7 | 75 | 575 | 30 | 16 |
|
. |
Peanuts, all types, dry-roasted, with salt | 17 | 1 | 4.0 | 61 | 112 | 30 | 9 |
|
. |
Peanuts, all types, dry-roasted, without salt | 17 | 1 | 4.0 | 61 | 112 | 30 | 9 |
|
. |
Sweet potato, cooked, baked in skin, without salt | 111 | -9 | 2.2 | 60 | 528 | 30 | 42 |
|
. |
Potato, flesh and skin, raw | 130 | -8 | 2.6 | 74 | 547 | 30 | 16 |
|
. |
Bread, whole-wheat, commercially prepared | 40 | 2 | 4.9 | 84 | 101 | 30 | 64 |
|
. |
Carrots, frozen, cooked, boiled, drained, without salt | 270 | -9 | 1.6 | 84 | 519 | 30 | 95 |

High Magnesium Key Foods List
As well as being important for general health, magnesium is an important contributor to alkaline diets. Supplementation is not healthy – you need to make good food choices from the list above.
Health Benefits of High Magnesium Foods
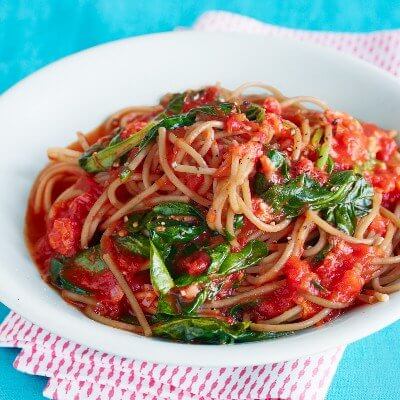
I can see that magnesium deficiency is a huge subject. So I will not review it in-depth until I can see sufficient Foodary readers are interested. However, I am interested in magnesium linked to Mediterranean Diet. Because I am planning to publish Mediterranean Eating plans soon.
A recent review of the effects of Mediterranean Diet in diabetes has some interesting facts about magnesium foods[1]. Because the authors note:
The proposed effect of Mediterranean diet against diabetes development was postulated to be an interplay between the pattern’s nutritional components. As it was observed, wholegrain cereals, legumes, and fruits consumption were primarily linked to the pattern’s anti-diabetic effect. Cereal-oriented dietary fiber has been suggested to act beneficially due to delayed gastric emptying, which slows down glucose absorption and reduces insulin levels, as well as the bran’s high magnesium concentration. Decreased intracellular enzymatic activity, due to magnesium deficiency, fosters insulin resistance. Legumes are also excellent magnesium sources.
If you have any questions, experiences, or opinions about magnesium in your diet, please use the feedback form below.
Leave Magnesium for PRAL Alkalinity to read the Foodary Nutrition Blog.
Magnesium for PRAL Alkalinity Related Topics
Please remember: to find more related pages that are relevant to you, use the search box near the top of every page.
Common Terms: Lists of Alkaline Foods and Drinks, Most Helpful Foodary Articles, popcorn, The pH Balance Diet
Other posts that include these terms:
- Alkaline Grains List
- Alkaline Herbs and Spices
- Acid-Alkaline Dairy and Egg Products Food List
- Alkaline Drinks List
- Acid-Alkaline Beef List
- Acid-Alkaline Legumes and Legume Products Food Chart
- Alkaline Nuts and Seeds List
- Alkaline Fish List
Magnesium for PRAL Alkalinity References
- Koloverou, E., D. B. Panagiotakos, C. Pitsavos, C. Chrysohoou, E. N. Georgousopoulou, A. Grekas, A. Christou et al. “Adherence to Mediterranean diet and 10‐year incidence (2002–2012) of diabetes: correlations with inflammatory and oxidative stress biomarkers in the ATTICA cohort study.” Diabetes/metabolism research and reviews 32, no. 1 (2016): 73-81.