
PRAL Potential Renal Acid Load : PRAL Acid Load Estimate
PRAL Acid Load Estimate
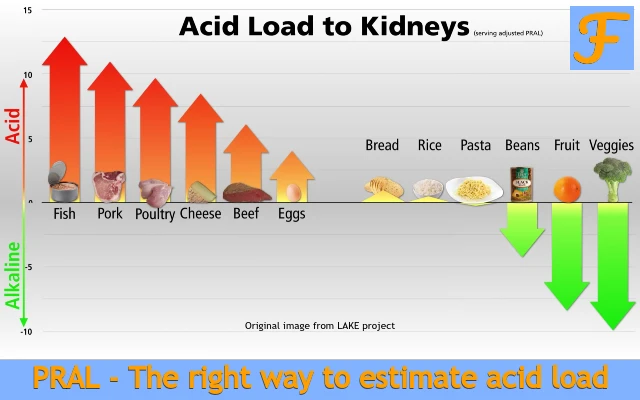
PRAL Acid Load Estimate is my featured image for PRAL Potential Renal Acid Load.
I based it on an image that has played some part in the LAKE Food Screener Project. I say “some part” because I cannot recall the exact study that this was part of. But I describe the published version of Load of Acid to Kidney Evaluation (LAKE) starting at Redefining Alkaline Diet Scores.
Note how the “official” LAKE acronym started with Acid Load to Kidneys in this image. Then “serving adjusted PRAL” highlights the essence of the LAKE scoring system. Where it averages PRAL across food groups. Also simplifying with servings rather than weighing all foods. This revelation prompted me to start developing ALKAscore.
Moving on, we see each of the food groups charted in order of decreasing acid load:
- Fish
- Pork
- Poultry
- Cheese
- Beef
- Eggs
- Bread
- Rice
- Pasta
- Beans
- Fruit
- Veggies
Finally, I added the acknowledgement to the LAKE project, and my title – “PRAL – The right way to estimate acid load”.
Leave PRAL Acid Load Estimate to read PRAL Potential Renal Acid Load.