High Calcium Foods and Drinks
Calcium is one of the 5 elements of the PRAL alkalinity calculation.
There is some interesting science behind that, but I like to provide easy to use tables so you can focus on food, not formulas. I only mention the science so you understand that PRAL is a proven method for estimating alkaline diets. Others rely on science fantasy, but Foodary uses science fact.
Speaking of facts, always remember that, despite its precision, PRAL is really an estimate to guide you towards pH balance. It’s a great tool for checking the important things relating to alkaline diet:
- Is my total diet is alkaline?
- Do I eat sufficient acidic foods?
- Which food changes will improve my alkaline diet?
High Calcium Foods and Drinks List Introduction
Calcium is one of the alkaline components of PRAL. Eating more calcium rich foods is generally good for an alkaline diet, but never eat excesses of any single nutrient. Government guidelines recommend a minimum Daily Value of 1,000 mg. That’s an average recommendation for a 2,000 calorie diet. If your energy requirements are different, or health conditions make you need to change, then set your own personal daily calcium requirement. In fact, the World Health Organization suggest that 500mg per day provides sufficient calcium.
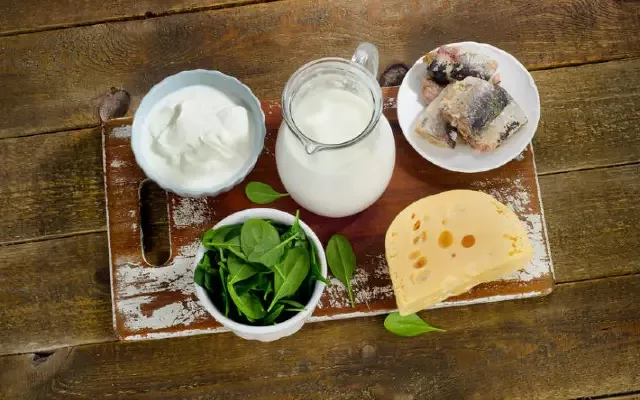
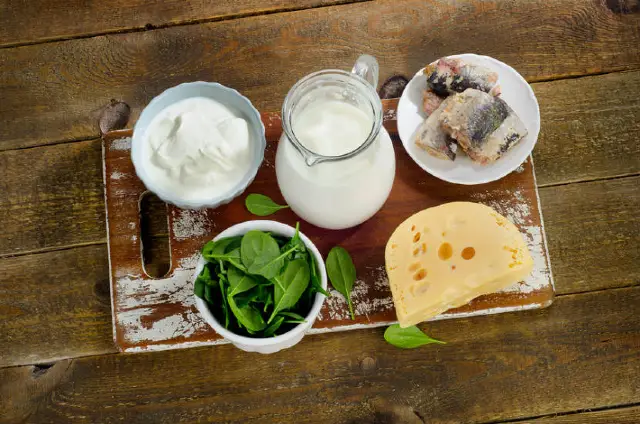
Traditional sources of calcium have been milk and dairy products. Modern nutrition advice goes beyond this simple view, the relevant points being:
- Milk and dairy foods should be limited to two servings per day to avoid vitamin A (retinol) overload
- Good vegetable sources of calcium generally contain vitamin K which is also good for bone health
- Calcium is vital for bone health, but it needs vitamin D. I will explain more about vitamin D in a separate article.
- Weight-bearing exercise is important to encourage bone growth.
All this means that managing calcium is more than just counting milligrams. Until I extend the database I use for nutrition data, I cannot provide the detailed analysis that is needed for the best diet planning. However, we are advised to switch from dairy sources of calcium, which was also mentioned in relation to alkaline beverages. My list of foods high in calcium will help you do that. Also, if your diet has a high proportion of foods from the following list, be careful that you do not overload on calcium.
Foods High in Calcium list
The table lists foods in order of highest calcium per 100 calorie serving. You can change the order by clicking on any heading, and repeat clicks will reverse the sort order.
|
. |
PRAL Nutrients Explanation | Cals Help | PRAL Help | Pro tein Help |
Phos phorus Help |
Potas sium Help |
Mag nesium Help |
Cal cium Help |
|
. |
Long Description | 100 Kcal Serve (g) | PRAL Score | Pro tein (g) |
Phos phorus (mg) |
Potas sium (mg) |
Mag nesium (mg) |
Cal cium (mg) |
|
. |
Cereals ready-to-eat, GENERAL MILLS, Whole Grain TOTAL | 31 | -12 | 2.6 | 83 | 96 | 25 | 1,042 |
|
. |
Turnip greens, cooked, boiled, drained, without salt | 500 | -25 | 5.7 | 145 | 1,015 | 110 | 685 |
|
. |
Cereals ready-to-eat, GENERAL MILLS, TOTAL Raisin Bran | 32 | -9 | 1.8 | 61 | 162 | 19 | 605 |
|
. |
Spinach, cooked, boiled, drained, without salt | 435 | -45 | 12.9 | 243 | 2,026 | 378 | 591 |
|
. |
Spinach, canned, regular pack, drained solids | 435 | -34 | 12.2 | 191 | 1,504 | 330 | 552 |
|
. |
Cheese, swiss, low fat | 56 | 11 | 15.9 | 338 | 62 | 20 | 537 |
|
. |
Mustard greens, cooked, boiled, drained, without salt | 385 | -9 | 9.8 | 162 | 623 | 50 | 454 |
|
. |
Spinach, frozen, chopped or leaf, cooked, boiled, drained, without salt | 294 | -20 | 11.8 | 147 | 888 | 241 | 450 |
|
. |
Chicory greens, raw | 435 | -36 | 7.4 | 204 | 1,826 | 130 | 435 |
|
. |
Spinach, raw | 435 | -51 | 12.4 | 213 | 2,426 | 343 | 430 |
|
. |
Collards, cooked, boiled, drained, without salt | 303 | -7 | 8.2 | 97 | 355 | 64 | 427 |
|
. |
Parsley, raw | 278 | -31 | 8.3 | 161 | 1,539 | 139 | 383 |
|
. |
Cheese, pasteurized process, american, low fat | 56 | 16 | 13.7 | 459 | 100 | 13 | 380 |
|
. |
Milk, nonfat, fluid, with added vitamin A and vitamin D (fat free or skim) | 294 | 1 | 9.9 | 297 | 459 | 32 | 359 |
|
. |
Milk, nonfat, fluid, without added vitamin A and vitamin D (fat free or skim) | 294 | 1 | 9.9 | 297 | 459 | 32 | 359 |
|
. |
Pickles, cucumber, dill or kosher dill | 833 | -16 | 5.0 | 100 | 767 | 58 | 350 |
|
. |
Milk, dry, nonfat, regular, without added vitamin A and vitamin D | 28 | -1 | 10.0 | 267 | 496 | 30 | 347 |
|
. |
USDA Commodity, cheese, cheddar, reduced fat | 35 | 7 | 9.6 | 207 | 33 | 12 | 321 |
|
. |
Cheese, mozzarella, part skim milk | 39 | 6 | 9.6 | 182 | 33 | 9 | 308 |
|
. |
Endive, raw | 588 | -35 | 7.4 | 165 | 1,847 | 88 | 306 |
|
. |
Orange juice, chilled, includes from concentrate, fortified with calcium and vitamin D | 213 | -8 | 1.4 | 100 | 379 | 23 | 298 |
|
. |
Orange juice, chilled, includes from concentrate, fortified with calcium | 213 | -8 | 1.4 | 100 | 379 | 23 | 298 |
|
. |
Milk, lowfat, fluid, 1% milkfat, with added vitamin A and vitamin D | 238 | 0 | 8.0 | 226 | 357 | 26 | 298 |
|
. |
Soymilk, original and vanilla, with added calcium, vitamins A and D | 233 | -4 | 6.0 | 100 | 284 | 35 | 286 |
|
. |
Cheese, pasteurized process, american, with di sodium phosphate | 27 | 4 | 5.0 | 175 | 36 | 7 | 286 |
|
. |
Cheese, parmesan, grated | 23 | 6 | 8.9 | 169 | 29 | 9 | 257 |
|
. |
Kale, cooked, boiled, drained, without salt | 357 | -15 | 6.8 | 100 | 814 | 64 | 257 |
|
. |
Celery, raw | 625 | -31 | 4.3 | 150 | 1,625 | 69 | 250 |
|
. |
Cheese, mozzarella, part skim milk, low moisture | 33 | 7 | 8.6 | 174 | 31 | 9 | 242 |
|
. |
Lettuce, green leaf, raw | 667 | -21 | 9.1 | 193 | 1,293 | 87 | 240 |
|
. |
Milk, reduced fat, fluid, 2% milkfat, with added vitamin A and vitamin D | 200 | 0 | 6.6 | 184 | 280 | 22 | 240 |
|
. |
Onions, spring or scallions (includes tops and bulb), raw | 313 | -16 | 5.7 | 116 | 863 | 63 | 225 |
|
. |
Cheese product, pasteurized process, cheddar or american, reduced fat | 42 | 10 | 7.3 | 345 | 138 | 14 | 220 |
|
. |
Cheese, provolone | 28 | 5 | 7.3 | 141 | 39 | 8 | 215 |
|
. |
Cabbage, cooked, boiled, drained, without salt | 435 | -14 | 5.5 | 143 | 852 | 65 | 209 |
|
. |
Cheese, swiss | 26 | 6 | 7.1 | 149 | 20 | 10 | 208 |
|
. |
Cheese food, pasteurized process, american, without di sodium phosphate | 30 | 3 | 5.1 | 133 | 77 | 8 | 207 |
|
. |
Yogurt, vanilla, low fat, 11 grams protein per 8 ounce | 118 | 0 | 5.8 | 159 | 258 | 19 | 201 |
|
. |
Cheese, monterey | 27 | 4 | 6.6 | 119 | 22 | 7 | 200 |
|
. |
Lettuce, cos or romaine, raw | 588 | -25 | 7.2 | 176 | 1,453 | 82 | 194 |
|
. |
Cheese spread, pasteurized process, american, without di sodium phosphate | 34 | 9 | 5.7 | 302 | 83 | 10 | 194 |
|
. |
Milk, whole, 3.25% milkfat, with added vitamin D | 164 | 0 | 5.2 | 138 | 216 | 16 | 185 |
|
. |
Tomatoes, red, ripe, canned, packed in tomato juice | 588 | -21 | 4.6 | 112 | 1,106 | 65 | 182 |
|
. |
Broccoli, frozen, spears, cooked, boiled, drained, without salt | 357 | -5 | 11.1 | 196 | 643 | 71 | 182 |
|
. |
Cheese, cheddar | 25 | 5 | 6.2 | 127 | 24 | 7 | 179 |
|
. |
Cheese, colby | 25 | 4 | 6.0 | 116 | 32 | 7 | 174 |
|
. |
Cereals ready-to-eat, GENERAL MILLS, FIBER ONE | 50 | -1 | 3.3 | 100 | 184 | 27 | 167 |
|
. |
Milk, chocolate, fluid, commercial, lowfat, with added vitamin A and vitamin D | 141 | 0 | 4.6 | 145 | 239 | 18 | 163 |
|
. |
Cabbage, raw | 400 | -11 | 5.1 | 104 | 680 | 48 | 160 |
|
. |
Cereals ready-to-eat, GENERAL MILLS, KIX | 28 | -1 | 2.2 | 53 | 62 | 14 | 160 |
|
. |
Cheese sauce, prepared from recipe | 51 | 3 | 5.2 | 116 | 72 | 10 | 158 |
|
. |
Beans, snap, green, canned, regular pack, drained solids | 400 | -7 | 5.0 | 84 | 424 | 52 | 152 |
|
. |
Beans, snap, green, frozen, cooked, boiled, drained without salt | 357 | -9 | 5.3 | 104 | 568 | 68 | 150 |
|
. |
Yogurt, fruit, low fat, 10 grams protein per 8 ounce | 98 | 0 | 4.3 | 117 | 191 | 15 | 149 |
|
. |
Yogurt, fruit, low fat, 10 grams protein per 8 ounce, fortified with vitamin D | 98 | 0 | 4.3 | 117 | 191 | 15 | 149 |
|
. |
Crustaceans, shrimp, mixed species, canned | 100 | 13 | 20.4 | 195 | 80 | 33 | 145 |
|
. |
Yogurt, fruit, lowfat, with low calorie sweetener | 95 | 1 | 4.6 | 127 | 185 | 15 | 145 |
|
. |
Yogurt, fruit, lowfat, with low calorie sweetener, fortified with vitamin D | 95 | 1 | 4.6 | 127 | 185 | 15 | 145 |
|
. |
Milk, chocolate, fluid, commercial, reduced fat, with added vitamin A and vitamin D | 132 | 0 | 3.9 | 134 | 222 | 18 | 143 |
|
. |
Formulated bar, POWER BAR, chocolate | 28 | 2 | 3.9 | 169 | 100 | 68 | 139 |
|
. |
Juice, apple, grape and pear blend, with added ascorbic acid and calcium | 192 | -5 | 0.3 | 21 | 171 | 12 | 138 |
|
. |
Broccoli, raw | 294 | -12 | 8.3 | 194 | 929 | 62 | 138 |
|
. |
Squash, summer, all varieties, cooked, boiled, drained, without salt | 500 | -16 | 4.6 | 195 | 960 | 120 | 135 |
|
. |
Milk, chocolate, fluid, commercial, whole, with added vitamin A and vitamin D | 120 | 0 | 3.8 | 122 | 201 | 16 | 135 |
|
. |
Tomatoes, red, ripe, canned, stewed | 385 | -15 | 3.5 | 77 | 796 | 46 | 131 |
|
. |
Lettuce, iceberg (includes crisphead types), raw | 714 | -16 | 6.4 | 143 | 1,007 | 50 | 129 |
|
. |
Beans, snap, green, cooked, boiled, drained, without salt | 286 | -6 | 5.4 | 83 | 417 | 51 | 126 |
|
. |
Cheese, ricotta, whole milk | 57 | 4 | 6.5 | 91 | 60 | 6 | 119 |
|
. |
Broccoli, frozen, chopped, cooked, boiled, drained, without salt | 357 | -1 | 11.1 | 175 | 507 | 46 | 118 |
|
. |
Spices, chili powder | 35 | -11 | 4.8 | 106 | 691 | 53 | 117 |
|
. |
Cucumber, peeled, raw | 833 | -19 | 4.9 | 175 | 1,133 | 100 | 117 |
|
. |
Mollusks, oyster, eastern, wild, raw | 196 | 4 | 11.2 | 190 | 306 | 35 | 116 |
|
. |
Soup, clam chowder, new england, canned, prepared with equal volume low fat (2%) milk | 164 | 5 | 5.3 | 284 | 293 | 20 | 115 |
|
. |
Broccoli, cooked, boiled, drained, without salt | 286 | -10 | 6.8 | 191 | 837 | 60 | 114 |
|
. |
Cereals ready-to-eat, GENERAL MILLS, LUCKY CHARMS | 26 | 1 | 2.0 | 76 | 58 | 19 | 114 |
|
. |
Crustaceans, crab, blue, cooked, moist heat | 120 | 12 | 21.5 | 282 | 312 | 43 | 110 |
|
. |
Cereals ready-to-eat, GENERAL MILLS, CHEERIOS | 26 | 0 | 3.2 | 127 | 170 | 34 | 106 |
|
. |
Cereals, QUAKER, corn grits, instant, plain, dry | 28 | 0 | 2.0 | 33 | 45 | 12 | 105 |
|
. |
Asparagus, cooked, boiled, drained | 455 | -10 | 10.9 | 245 | 1,018 | 64 | 105 |
|
. |
Sauce, salsa, ready-to-serve | 345 | -16 | 5.3 | 117 | 983 | 52 | 103 |
|
. |
Cereals ready-to-eat, GENERAL MILLS, COOKIE CRISP | 26 | -1 | 1.4 | 41 | 61 | 8 | 101 |
|
. |
Cereals ready-to-eat, GENERAL MILLS, Rice CHEX | 27 | 0 | 1.8 | 39 | 44 | 8 | 99 |
|
. |
Waffles, plain, frozen, ready -to-heat, toasted | 32 | 4 | 2.3 | 138 | 46 | 8 | 98 |
|
. |
Bread, white, commercially prepared (includes soft bread crumbs) | 38 | 1 | 3.5 | 39 | 43 | 9 | 98 |
|
. |
Cereals, oats, instant, fortified, plain, dry | 28 | 2 | 3.3 | 117 | 101 | 35 | 97 |
|
. |
Waffle, buttermilk, frozen, ready-to-heat, toasted | 32 | 4 | 2.4 | 144 | 45 | 7 | 97 |
|
. |
Cereals ready-to-eat, GENERAL MILLS, COCOA PUFFS | 26 | 0 | 1.5 | 58 | 71 | 15 | 97 |
|
. |
Fast Food, Pizza Chain, 14″ Pizza, cheese topping, thin crust | 33 | 3 | 4.3 | 98 | 66 | 8 | 95 |
|
. |
Cereals ready-to-eat, GENERAL MILLS, HONEY NUT CHEERIOS | 27 | 0 | 2.3 | 76 | 109 | 23 | 95 |
|
. |
Carrots, frozen, cooked, boiled, drained, without salt | 270 | -9 | 1.6 | 84 | 519 | 30 | 95 |
|
. |
Cereals ready-to-eat, GENERAL MILLS, Multi-Grain Cheerios | 27 | -1 | 2.2 | 76 | 133 | 15 | 95 |
|
. |
Cereals ready-to-eat, QUAKER, QUAKER OAT LIFE, plain | 27 | 2 | 2.7 | 113 | 76 | 26 | 94 |
|
. |
Ice creams, vanilla, light | 56 | 0 | 2.7 | 57 | 116 | 8 | 89 |
|
. |
Cereals ready-to-eat, GENERAL MILLS, Corn CHEX | 27 | 0 | 1.7 | 35 | 53 | 7 | 87 |
|
. |
Mustard, prepared, yellow | 149 | 2 | 6.5 | 158 | 206 | 73 | 87 |
|
. |
Carrots, cooked, boiled, drained, without salt | 286 | -12 | 2.2 | 86 | 671 | 29 | 86 |
|
. |
Oranges, raw, all commercial varieties | 213 | -8 | 2.0 | 30 | 385 | 21 | 85 |
|
. |
Cereals ready-to-eat, GENERAL MILLS, REESE’S PUFFS | 24 | 0 | 1.6 | 50 | 59 | 13 | 84 |
|
. |
Cereals ready-to-eat, GENERAL MILLS, Honey Nut CHEX | 27 | -1 | 1.7 | 17 | 42 | 7 | 83 |
|
. |
Cream, fluid, half and half | 77 | 0 | 2.3 | 73 | 100 | 8 | 81 |
|
. |
Carrots, raw | 244 | -14 | 2.3 | 85 | 780 | 29 | 80 |
High Calcium Food Sources
Your High Calcium Key Foods List
Calcium can certainly help improve your pH balance diet. But, just focusing on calcium is not the right way to plan an alkaline diet. If you believe you have too little calcium in your diet, then this list will help you find better food choices. Similarly, if you have too much calcium in your diet, then reducing intake of some of these high calcium foods will give you better balance.
If you have any questions, experiences, or opinions about calcium in your diet, please use the feedback form below.
Leave High Calcium Foods and Drinks to read about other elements of the PRAL alkalinity calculation.
High Calcium Foods and Drinks Comments
Foodary visitor responses and associated research include:
Calcium Supplements or Natural Calcium Food Sources?
Katherine asked, “I see the fruit juices here are fortified with added calcium. Wouldn’t it be better to just take calcium supplements?”
I responded with a few points:
- The purpose of my PRAL information is to help you discuss nutrition issues with your health professionals. So firstly you must think about any medical advice you get about calcium intake. Because for most people I advise eating natural foods with as little processing as possible. But your medical needs come first.
- I’ve included the fortified juices and other foods in my PRAL lists. Because they are included in the USDA database. But that does not mean they are right for you. Again, you must seek medical advice before you change your diet. So ensure you discuss added calcium with your doctor before switching to fortified juices.
- When you discuss calcium supplementation with your health advisers, I recommend you ask about relevent research[1]. It concludes that:
Calcium from dietary sources […] may produce more favorable effects in bone health […] than will calcium from supplements.
Note that is a specific recommendation for the group of subjects studied. But it continues to be widely quoted as a relevant authority (Sep 26, 2020). If you would like me to review that report please let me know.
High Calcium Foods and Drinks Related Topics
Please remember: to find more related pages that are relevant to you, use the search box near the top of every page.
Common Terms: calcium, chocolate, Most Helpful Foodary Articles
Other posts that include these terms:
- Alkaline Grains List
- Alkaline Herbs and Spices
- Acid-Alkaline Dairy and Egg Products Food List
- Alkaline Drinks List
- Acid-Alkaline Beef List
- Acid-Alkaline Legumes and Legume Products Food Chart
- Alkaline Nuts and Seeds List
High Calcium Foods and Drinks References
- Napoli, Nicola, Jennifer Thompson, Roberto Civitelli, and Reina C. Armamento-Villareal. “Effects of dietary calcium compared with calcium supplements on estrogen metabolism and bone mineral density.” The American journal of clinical nutrition 85, no. 5 (2007): 1428-1433.